Sep 29, 2008

BETTER TECHNOLOGY, Richard Lester, MIT


Accelerating new energy technologies

Prof. Richard Lester is now working with others to make new energy technologies as paradigm shifting as the cell phone.

Prof. Richard Lester is now working with others to make new energy technologies as paradigm shifting as the cell phone.

When MIT researcher Richard K. Lester first started delving into innovation, mobile phones were big, clunky devices used in cars. To its credit, the fledgling mobile phone industry did not equate future success with turning out the best possible car phone.

Lester, director of the Industrial Performance Center (IPC) at MIT and professor of nuclear science and engineering, is convening a posse of MIT powerhouse thinkers to figure out how solar and other new energy technologies can become as ubiquitous and paradigm shifting as the cell phone.

Unlike some pundits, Lester says it’s not just a matter of getting the price right.

“We have to figure out how to accelerate the introduction of new energy technologies in different sectors,” says Lester, who has led studies of national and regional productivity, competitiveness, and innovation for governments and industrial groups around the world. “The common debate is about which technology is better, but what we have paid less attention to as a country is the ways in which new technologies find their way into the marketplace.”

Lester has enlisted dozens of MIT experts over the years to pay attention to this and other issues in innovation. Through the IPC, an MIT-wide research unit based in the School of Engineering, interdisciplinary teams of economists, political scientists, scientists, engineers, and management and policy experts have conducted more than 2,000 visits to producers of everything from cars to acid-washed jeans. They have talked to researchers, government officials, and corporate executives to figure out how innovation happens and how the products of innovation find their way to consumers.

Power plants, transmission lines, and wind turbines are on a larger scale than phones and jeans, but energy is a commodity nevertheless. It’s a commodity most people “aren’t particularly interested in. Energy enables us to cook, live in a pleasant environment, get from place to place, but energy itself is just one input into other things we care much more about,” Lester said.

USING ENERGY EFFICIENTLY

“What’s also clear is that if we’re going to have any chance of avoiding the most serious consequences of global climate change, a big part of the answer is going to have to involve using energy more efficiently, innovating on the demand side of the sector,” and advancing the way energy is used in industry, in commercial buildings, and in the home. “We’ll really have to enter into the life of the user,” Lester said. “That kind of innovation is a process requiring interpretive capabilities many of us aren’t very familiar with.”

Carbon emission taxes and cap-and-trade schemes have been billed as the means to “somehow call forth the necessary innovation” to bring about quantum change, but 30-plus years of analyzing innovation has convinced Lester it’s not that simple.

The IPC’s latest initiative, the Accelerating U.S. Energy Innovation project, enlists MIT’s top energy experts — Ernest J. Moniz, director of the MIT Energy Initiative; Institute Professor John M. Deutch; management professor Rebecca Henderson; political scientists Stephen Ansolabehere and Edward Steinfeld; economist Michael J. Piore; and others — to think systematically about how the energy innovation system works and how we can strengthen it. Funded by the Doris Duke Charitable Foundation, the project will include around 20 researchers and students. Solar energy is among the emerging technologies the group will look at.

Lester has been thinking about “messy” problems since he came to MIT as a nuclear engineering graduate student determined to halt nuclear weapons proliferation.

While he has continued to work in nuclear engineering — he recently developed recommendations on how to deal more effectively with U.S. nuclear power plant waste — his reach extends to many thorny problems involving technology, politics, and economics on an international scale.

Before “interdisciplinary” was a buzzword, a handful of MIT faculty formed the MIT Commission on Industrial Productivity. At first, cultures clashed. “The commission almost broke up because people had such difficulty communicating with each other across these disciplinary boundaries,” Lester says. “But we stuck with it.”

A LIFE OF ITS OWN

What the group eventually learned is that innovation is “like an open-ended conversation,” Lester says. “Sometimes you don’t know where it’s going and it develops a life of its own. Successful innovators are organizations that understand innovation is at least partly about keeping the conversation going because that, in the end, is how new ideas emerge.”

Universities can play an important role by being places where these kinds of conversations can take place. This idea is taking Lester halfway around the globe to a university MIT is helping set up in Abu Dhabi. Called the Masdar Institute of Science and Technology, its founders have asked Lester to study the role universities can play in developing innovative technologies to enhance economic development and promote new industries using renewable energy and resources.

“When I first started out bringing together experts from disparate fields to address major global issues such as energy, I was kind of an outlier,” Lester said. “I think that’s changing, and I think part of MIT’s real educational value is in exposing more students to these very complex, messy problems in which the only way you can make progress is to bring in all of the dimensions at once.”

by Deborah Halber


On Topic: 

Sep 26, 2008

Electric Power Research Institute gets $1.7M for wave power research

JEREMY JACQUOT | 

The Department of Energy (DoE) has been conspicuously doling out grants left and right to support several clean energy initiatives in recent months. The latest beneficiary, to the tune of $1.7 million, is the Palo Alto, Calif.-based Electric Power Research Institute (EPRI), which will use the funds to develop and test advanced water power technologies.

EPRI will use the first $1.2 million grant, which will be awarded over a 2-year period, to continue the development of its environmentally benign hydrokinetic turbine in partnership with Alden, a Holden, Mass.-based hydraulic and fluid dynamics research laboratory, and Concepts NREC, a White River Junction, Vt.-based turbomachinery developer.

The non-profit research organization claims the turbine design will reduce fish mortality rates to less than 5 percent while boosting power conversion efficiecy to 90 percent or higher. When deployed commercially, the turbines could generate an additional 25 gigawatts of hydropower capacity in the United States. As part of its Ocean Energy Program, the EPRI has several ongoing or planned tidal, wave and river hydrokinetic power projects in California, Washington, Alaska and other states.

The second $500,000 award will be used to develop a state-by-state wave power resource assessment — to help project developers determine the amount of available wave energy potential around the U.S. — and geographic information system (GIS) database.

So far, the DoE has allocated $7.3 million to support water power projects, many of which, including EPRI’s, require a 50 percent industry funding match.

Sep 21, 2008

Where are the Input-Ouput Models for Analyzing Energy Flows?

As a student at MIT in 1972, with a expertise in economics and computer sciences, we built one of the first input-output models for analyzing the impact of oil prices on the economy. 

What happened to these models? 

How can the Republicans and Democrats propose policy without this data?

What is An Input-Output Model

The Input-Output model is a massively simultaneous system of equations. The equations quantify the impact of price change on each sector of the economy. Both short and long term impacts can be forecasted by quantifying the elasticity by sector over time. Time series methods corrected many of the estimation errors caused by simultaneous data streams. Leading models came out of MIT, UCLA, and Carnegie

Google page rank (PR) uses the same massively simultaneous system of equation method for near realtime computations. My team at MIT innovated to enable these solutions with large systems.

The model tells us the direct impact, that increases in prices results in higher gasoline prices. With small changes, the demand impact is relatively inelastic. This means consumer behavior does not change much.

With the first significant oil price change in 1972, we had our first historic data point to show that the price response was not linear. Large changes have much greater impact than small changes. As forecasters, all historic models used linear estimation and were forced to fudge the data to estimate results that were different from historic patterns based on low price changes.

The model also measures indirect impacts over time. Higher gasoline prices impacted general inflation causing price increases for all goods. Over a longer period of time, commercial interests increased oil efficiency or shifted to other resources. Thus, the model quantifies the hundreds of complex economic cycles as the economy settles into a new equilibrium.

Applying the Model to the Web 2.0 Economy

As a current innovator in the Web 2.0 economy, I've hypothesized the relationship of radical oil price change to web 2.0 adoption. Specifically, an input-ouput model would show the following relationships:
  • Increased Web 2.0 Use: Web 2.0 provides news, entertainment, and information over the Internet. This decreases casual driving about town. With higher gasoline prices, consumers would immediately reduce driving and consume more services at home. The relationship is non-linear with oil price change. Early data on web 2.0 trends and gasoline consumption show the inverse relationship. Is it statistically significant?
  • Telecommuting and Home Work: Web 2.0 enables more telecommuting and work at home professionals to be productive without wasting (1) time commuting and (2) dollars for gas. The impact is again inversely non-linear with oil price change.
  • Shift of Advertising from Paper to Web 2.0: Although this trend is true, proper analysis would show that the marginal impact from oil price increases would be insignificant. Higher transport costs increase the cost of producing, printing, and distributing paper. This includes direct mailers, newspapers, and magazines. However, the marginal impact would not reduce gasoline consumption among transporters such as the US Post Office, Fedex, UPS, and other shippers. Their costs are fixed and lower demand for shipping services won't decrease the cost to continue making the rounds for non-paper customers.
Similar hypothesis can be formed on hundreds of economic sectors. Together, the input-output model would integrate the complex relationships to produce short and long term forecasts. Like the Lionel Edie/Merrill Lynch/Bank of America group where dozens of sector economists cooperated to create one model, econometric models enable "blind men to see the elephant".

What Happened to the Input-Output Models?

The sector analysis above demonstrates the value of input-output analysis. 

To verify my hypothesis, I searched for models and was shocked to see no updated studies relating to energy costs. Yet, candidates like Obama and McCain have proposed solutions without the data. How can those policy decisions make sense?

Energy Independence

The US consumes more oil than the next 20 countries combined. Our dependence on this scarce, imported resource hurts our short, near, long term future. Should we invest more to understand the problem?

T. Boone Pickens' Video Cam on Energy Independence


Boone says “Economy is sick” and the problem is we are paying too much for energy. Plus, More Pickens Plan ads on the way!

This episode’s links: Pickens Plan | Pledge | Contact Congress

Sep 19, 2008

N.Y. Tests Turbines to Produce Power


N.Y. Tests Turbines to Produce Power

City Taps Current Of the East River

In this 2006 photo, a Verdant Power turbine is lowered into the river off Roosevelt Island. This one failed.
In this 2006 photo, a Verdant Power turbine is lowered into the river off Roosevelt Island. This one failed. (Associated Press)

Washington Post Staff Writer 
Saturday, September 20, 2008; Page A02

NEW YORK -- On a recent morning, a crane sank a 16-foot rotor into the waters of the East River and divers swam deep to bolt it to the bottom. By early evening, as the northerly current sped up, the rotor began to spin, a big thunk sounded in the control room, a green light went on, and electricity began to pour into a nearby supermarket.

The scene represents an experiment in tidal power, using turbines that look like underwater windmills, and it is the first of its kind nationwide and one of only a few such pilot projects in the world.

"This is just the beginning of a project, but the project itself is emblematic of a whole new industry," said Trey Taylor, the president of Verdant Power, a small company that created the experiment and hopes to expand it to commercial use with 300 turbines in the East River that could power up to 10,000 homes in the city.

Engineers, policymakers and energy experts say projects like the East River tidal turbines are already placing this city at the urban vanguard of energy production. They say New York City is uniquely positioned to advance sustainable energy projects because of the city's enormous need for power, its high electricity costs, and the pressure for new sources created by its unusual rule that 80 percent of energy must be generated within the city.

Mayor Michael R. Bloomberg has sought to make New York the cleanest and greenest major city in the country. He has faced setbacks -- for example, when his congestion pricing plan to reduce the number of cars in Manhattan was killed by the state legislature. He was mocked when he spoke of placing windmills on bridges and skyscrapers, and a few New York tabloids ran illustrations of wind turbines on the Brooklyn Bridge and theEmpire State Building.

Still, he has asked private companies to submit ideas to develop wind, solar and water energy projects. And for the past year, his administration has supported the water turbines, a project many years in the making.

The idea is simple: As water flows, it spins the rotors and produces electricity. The turbines run according to the tide charts, which are as predictable as phases of the moon.

The idea was rejected for state funding in 2000, only to be accepted a few years later.

The strength of the flows of the East River -- which is technically not a river, but a tidal strait, whose current switches direction throughout the day -- makes it an ideal spot for generating power. The strength of the current also makes it hard on equipment. Swift-moving waters chewed up the first two types of turbines, which Verdant, a small, private company, installed in late 2006 and early 2007.

The first blades were fiberglass with a steel skeleton. Later, another set of rotors was made from aluminum and magnesium.

"The water was very powerful, so it broke the rotors," Taylor said.

The newest blades are made from an aluminum alloy, attached to rotors whose strength has been extensively tested. If all holds together, Taylor expects to apply for permission to expand and launch a commercial operation.But the capacity of the turbines is not the only stumbling block. There were years of environmental testing on the site, including an investment of more than $2 million to monitor the impact on fish and migratory birds. Both have avoided the big, clunky turbines thus far, Taylor said, but regulations require ongoing inspections.

The city needs new ways to generate energy because existing transmission lines from upstate are inadequate and the city's needs are growing, said James Gallagher, energy expert at the city's Economic Development Corp.

"We need generation within the city, and anything we can add in terms of clean, efficient, new generation, has a value to it," he said.

He and other analysts say tidal power is a small piece of the city's energy equation. In fact, New York is learning the rules of the game for its own brand of urban sustainable energy production: The winds and waters of this port city can be harnessed, but only in certain places. Tidal power is reliable, but small-scale. Wind power is cheap but rare. Solar power is unreliable, inconstant and expensive but easy to install.

Experts warn that before these alternatives are widely adopted, New York will have to upgrade its antiquated grid system, which is currently incapable of incorporating a great deal of power from multiple small sources.

The city's peak energy consumption is 12,000 megawatts at any given moment, said Stephen Hammer, the director of the Urban Energy Program at Columbia University. "The question is, 'What's our goal? How much of that 12,000 megawatts total do we want to try to achieve? What kind of cost burden do we want to bear to achieve it?' "...


Sep 18, 2008

Al Gore to Buy Environmental Magazine, 'Plenty'?

Al Gore's getting into the magazine business. Sources familiar with the former vice president's plans say he is set to announce the acquisition of a stake in Plenty, a four-year-old title about environmentally-conscious living. As it happens, Gore -- who already has a toe in the media business through his TV network, Current -- is on the cover of the current issue.

Asked about the situation, Plenty founder Mark Spellun acknowledged there is a deal of some sort in the works but said it was "not correct" to say that Gore was buying the company. "That wouldn't be quite accurate," he said. Pressed on whether that means Gore is purchasing some sort of interest, however, either directly or through another entity, Spellun declined to comment further, saying an announcement would come next week.

Whatever Gore's role in Plenty turns out to be, the title would seem to be a good fit with his post-political emphasis on curbing global warming. According to its media kit, Plenty uses more than than 85 percent recycled paper and keeps its production process carbon-neutral through the purchase of offsets. The magazine is published bimonthly and has a rate base (the minimum circulation guaranteed to advertisers) of 200,000.

Sep 17, 2008

Google and General Electric Team Up on Energy Initiatives

By MIGUEL HELFT

Google and General Electric said Wednesday that they would work together on technology and policy initiatives to promote the development of additional capacity in the electricity grid and of “smart grid” technologies to enable plug-in hybrids and to manage energy more efficiently. The companies said their goal is to make renewable energy more accessible and useful.

Google’s chief executive, Eric Schmidt, and G.E.’s chief executive, Jeffrey Immelt, alluded briefly to the partnership during a joint appearance at Google’s Zeitgeist conference, which is taking place at the company’s headquarters in Mountain View, Calif.

The two executives gave few details of their planned collaboration. In an interview following their presentation, Dan Reicher, director of climate change and energy initiatives at Google.org, an operating unit of Google, said the effort was in its planning stages and did not have a set budget.

“All this talk about renewable energy will not be realized if we do not build substantial additional transmission capacity,” Mr. Reicher said.

Without additional capacity, Mr. Reicher said, it would not be possible, for example, to get power from a solar plant in the Mojave Desert to Los Angeles, or from a wind farm in the Dakotas to Chicago. Mr. Reicher said that environmental standards, overlapping state and federal regulations and other policy issues are among the biggest impediments to building additional transmission capacity.

Google and G.E. are also discussing how to combine their respective software and hardware expertise to enable technologies like plug-in hybrids on a large scale and to accelerate the development of geothermal energy.

For Google, the partnership with G.E. is part of larger set of energy initiatives, including direct investments in green technology to help develop renewable energy that is cheaper to produce than coal-generated power. For its part, G.E. has made a large bet on green energy technologies, an initiative the company calls “Ecomagination.”

Tesla Motors’s Second Electric Car Will Be Made in San Jose

By CLAIRE CAIN MILLER

Tesla Motors’ second all-electric car, the Model S, is one step closer to reality.

On Wednesday morning, the company will announce a deal to lease 89 acres of land in San Jose, Calif. to build a company headquarters and a 600,000-square-foot plant to produce the battery-powered Model S sedan. (The company’s first model, a $109,000 roadster, is assembled in England and California.)

“This could bring 1,000 green-collar manufacturing jobs, which we’re trying to get back after losing a lot in the bust,” said San Jose Mayor Chuck Reed.

Tesla is the most recent clean technology company to set up manufacturing in Silicon Valley. “We have had a change here in the last year in manufacturing jobs, and Tesla is the latest,” Mr. Reed said, citing thin-film solar companies that are also manufacturing in the region.

The Model S will drive on the power from a lithium-ion battery pack and will be able to travel about 200 miles per charge. It will hit the roads at the end of 2010, the San Carlos, Calif., company said, and will sell for around $60,000. That is half the price of the 2010 Tesla Roadster sports car, which has a one-year waiting list.

Tesla generates a lot of excitement in Silicon Valley, thanks in part to high-profile backers that include Jeff Skoll, former president of eBay; Larry Page and Sergey Brin, co-founders of Google; and Tesla chairman Elon Musk, co-founder of PayPal. Venture capital investors include Capricorn Investment Group, Technology Partners, VantagePoint Venture Partners and Draper Fisher Jurvetson.

The decision to manufacture the Model S in California came as a surprise when it was announced in June. Tesla backed out of an earlier agreement to open the plant in New Mexico. Ze’ev Drori, Tesla’s chief executive since November, wanted the car to be made in California, where Tesla has been based since its founding in 2003.

“Silicon Valley is the birthplace of the silicon revolution. Now Silicon Valley is going to be a birthplace again, this time of the clean tech industry, and Tesla epitomizes that industry,” he said.

California made it easy by offering Tesla incentives worth around $15 million and possibly more, Mr. Drori said. That includes waiving rent for the first 10 years of the 40-year lease on the San Jose property and waiving state sales tax on $100 million worth of equipment. New Mexico was reportedly offering Tesla around $7 million worth of incentives...


Sep 15, 2008

Event: The Hunt for Blackgold


  • The Hunt for Black Gold

    "The Hunt for Black Gold" hosted by Maria Bartiromo follows the flow of oil from the moment it comes on line, to the supertankers, refineries and finally the consumer's gas tank. This CNBC special profiles Alaska's North Slope to the Gulf of Mexico - critical areas in the national oil debate. PREMIERES Wednesday, September 24th 9p | 1a ET


Oil Price Increases Impact Economy

Ed: This is an analysis of the energy multiplier from March 2000. A few observations:
  • Economic analysis depends on historic data. Oil prices increase direct costs like increased heating and gasoline expenses, indirect costs from higher prices for goods and services, and wage inflation. The cycle takes 3 to 4 years before economists can conclude the cyclical impact. 
  • Forecasts can be short sighted. For example, this 2000 study concluded:
    In summary, the reduced utilization of petroleum in the U.S. and Michigan economies in the past 20 years makes us less vulnerable to economic disruptions due to increases in crude oil and petroleum product prices. However, the recent price increases have been significant and, while they are not expected to cause a severe impact on the economy as a whole, the impact on low-income households can be crucial.
  • The estimated multiplier is 2x the percentage of household income spent on fuels. 
  • When prices increase dramatically, the multiplier may not be linear. Linear forecast is the normal extrapolation from data-constrained economists.
  • Slow, inaccurate economic analysis contribute to the Energy Independence problem.


Oil Price Increases Impact Economy
Less Now
March 3, 2000

Michigan Public Service Commission
Department of Consumer and Industry Services


The sharp increase in crude oil and petroleum product prices since the spring of 1999 have had little impact on the national and Michigan economies. After falling to about $10 a barrel a year ago, crude oil prices reached $30 a barrel in January and February 2000. During the four years of the 1979-1982 recession, the average cost of crude oil was more than $28 a barrel, and the impact of high oil prices had a devastating impact, triggering the worse recession since the Great Depression. Analysis suggests:

  • Economy-wide expenditures for petroleum are currently three to four times smaller than in 1979-1982. Efficiency improvements, switching to other fuels, and much lower inflation-adjusted petroleum prices all contribute to less utilization of petroleum in the U.S. and Michigan economies.
  • The momentum of the economic expansion appears to be sufficiently larger so as to override any impact of the oil price increases seen to date. However, if crude oil prices remain at or above $30 per barrel, there may be some potential for a slowing of the economic expansion. With concerns about economy over-heating, any slowdown might actually be helpful to reduce inflationary pressures.
  • While the impact of rising prices is much smaller on the U.S. and Michigan economies, the impact is significant for low-income households. This is especially true for those Michigan households heating with fuel oil or propane.

The U.S. Experience 1979-1983


Prior to the 1970s, the world's petroleum prices were largely controlled by the Texas Railroad Commission. In 1973, the Organization of Petroleum Exporting Countries (OPEC) began to assume a major influence on oil prices. Impacts are clearly seen in Figure 1, which shows crude oil prices from 1967-1998.

OPEC, founded in 1960 by five leading oil producers including Saudi Arabia, had previously not attempted to influence oil prices. OPEC had originated to help coordinate its members' petroleum policies and safeguard their interests. In 1970, its members each agreed to set an oil export tax rate of 55 percent. Then, in 1971, OPEC members began to nationalize the oil industry by

negotiating its transfer from the oil companies that had previously negotiated rights to the oil.

The Arab-Israeli War in 1973 and the U.S. support of Israel contributed to causing the first significant oil price increase by OPEC. In October 1973, Arab members of OPEC declared an embargo on exports to the U.S. As a result, crude oil prices increased from an average of $4.15 per barrel in 1973 to $9.07 in 1974, and this price increase led to the U.S. recession in 1974.

In the late 1970 s, political unrest in the Mid-East created conditions for the dramatic oil price increases of 1979-1981. The government under of the Shah of Iran, supported by the U.S., was the center of turmoil. When anti-west Islamic fundamentalists gained control of the country during the Iranian Revolution, Iranian oil production declined dramatically, leading to huge price increases. U.S. crude oil prices increased from $12.46 per barrel in 1978 to $35.24 in 1981.

Once again, oil price increases put the U.S. and other industrial economies into a recession, this time the worst recession since the Great Depression. Inflation skyrocketed, peaking at 13.5 percent in 1980 and averaging 10.3 percent in the 1979-82 period.

Recent Oil Price Developments

The cost of crude oil for U.S. refiners was just over $20 in 1996. Prices dropped slightly in 1997 and then fell to just $12.04 per barrel in 1998. For the first two months of 1999, the acquisition cost for crude fell again – to $10.50 a barrel. In these years, countries around the world benefitted from the lower costs of virtually all petroleum products.

In early 1999, most petroleum analysts viewed oil prices as artificially low, and the resulting low prices cut revenues to oil exporting countries. To address this situation, OPEC met in March 1999 and agreed to cut production, with a goal of increasing crude prices to around or just above $20 per barrel. Although compliance to previous OPEC agreements had been difficult to maintain, adherence to this agreement has generally been good. Crude oil prices rose immediately, to $15 in April and to above $21 per barrel (U.S. refiner cost) by September 1999. OPEC met again in September 1999 and agreed to maintain the production cuts through March 2000.

The production cuts combined with persistent world economic growth pushed crude oil prices up, to above $24 in December. In early January 2000, Saudi Arabia indicated OPEC's resolve to stick to the production cuts through March, in spite of declining world crude oil and product inventories. Prices continued up, hitting $30 per barrel in January and again in February 2000, compared to $10.25 one year earlier.

Indications from OPEC members in late February now suggest that production will be stepped up when OPEC next meets in March; some indications suggest that production has already started to increase. It is clearly in OPEC's interest to maintain market stability without harming the world's economy.

Why the Little Apparent Economic Impact of Recent Oil Price Increases?

So far the U.S. and Michigan economies haven't reacted to the recent petroleum price increases. Is the impact yet to come? Perhaps the impact won't occur until the price sticks for a time at some threshold price, maybe $35 or $40 dollars per barrel?


In fact, the key change is that the U.S. and other economies are much less dependent on oil than they were 20 years ago. Two factors account for this change. First, $30 oil this year is much less expensive than $30 oil in 1980 due to inflation. Second, and more significant, the utilization of petroleum in the U.S. economy is much less now; the U.S. simply produces much more national output for each barrel of oil consumed.

Figure 2 shows the impact of adjusting crude oil prices for inflation. The inflation-adjusted prices are in 1999 dollars. The figure shows the 1981 year's actual price of $35 adjusts to $60 dollars a barrel in today's dollars. This suggests that, in real terms, oil prices would have to reach $60 per barrel today to match the 1981 price and the resulting impacts. Note too that once adjusted for inflation, today's oil prices are almost as low as those in the late 1960s.

Efficiency improvements and the use of other energy sources, such as natural gas and electricity, have also lessened the dependence of the U.S. economy on oil.


Figure 3 shows the improved performance of the U.S. economy based on per barrel of oil consumed. In the 1970s, the economy generated about $250,000 of national output based on per barrel of oil consumed. Now the economy produces over $450,000 per barrel, an 80 percent improvement.

Figure 4 shows crude oil expenditures as a percent of Gross Domestic Product (GDP). The graph essentially reflects the combined effects of inflation and the decreased reliance on oil. As the figure shows, the U.S. economy spent more than 6 percent of GDP on crude oil in

1980 and 1981, when crude oil averaged $28 a barrel. In 1996-97, crude oil averaged $20 per barrel, 28 percent less than in 1980-81. However, the percent of GDP spent on crude oil is less than 2 percent and was just 1 percent in 1998, compared to more than 6 percent in 1980-81. This indicates that rising oil prices are less capable now of affecting the economy than they did in 1980. (Crude oil expenditures represent about one-half the retail costs of petroleum products.)

Additionally, Figure 4 shows two hypothetical oil price projections for the year 2000, at $20 and $40 per barrel. The $40 per barrel price (not a projection, and set for illustration only) would yield U.S. crude oil expenditures only 3 percent of the GDP. While such an increase might slow the current economic expansion, the impact of $40 oil on the present economy would be less than in any of the 11 years during 1974-1985 and less than one-half the impact of 1980-81.

Price Impacts

Michigan and the nation are impacted by higher oil prices by direct, indirect, and induced economic multiplier effects. Direct impacts are the increased expenses for purchased oil or oil products. Indirect impacts include the changed prices paid for other products and services, which pass along the higher fuel costs in the product prices. Last are the induced impacts of price increases. The initial direct and indirect impacts cause consumer prices to rise, and this feeds through to wage increases, which raises labor costs, which, in turn, raises the prices of products and services.

The U.S. General Accounting Office (GAO) in "The Prospects for Economic Recovery," February 1982, concluded that the increase in oil prices directly and indirectly caused most of the high inflation in the 1979-1981 period. For consumer prices, the GAO looked at the direct increases in expenses for consumers for gasoline, fuel oil, etc. and the indirect costs of higher prices for other goods and services.

Figure 4 captures in a simple way the direct and indirect impacts to consumers. This figure shows that crude oil expenses rose from about 4 percent of GDP in 1978 to 6.5 percent in 1981. This 2.5 percent increase passes through to households directly in gasoline and heating fuel costs, and indirectly in higher prices of goods and services, which roll in their higher input (fuel) costs. The total direct and indirect impacts are approximately the full 2.5 percent change in total economy costs resulting from the crude oil price increase.

This created another round of price increases. In the 1979-82 period, many wage contracts had automatic price escalators (consumer price indices). Assuming 80 percent of wages and salaries increased to offset the 2.5 percent increase in consumer costs, the total wage bill for the economy would rise 2.0 percent (2.5 x .80), and this would again raise prices for consumers. The impact was repetitious in the 1979-82 period, leading to final consumer price impacts which were more than double the initial 2.5 percent impact. These are the induced impacts of the initial price increase.

Today, the induced effects are almost negligible because wage contracts are not typically tied to a price escalator as they were in 1980. Therefore, a petroleum price increase this year would be absorbed into consumer budgets with virtually no (or a very small) step up in labor costs. Breaking the firm link between increasing consumer costs in wage agreements has served to mitigate the economic multiplier impact of price increases.


Michigan Oil Expenditures Trend

Figure 5 shows embedded crude oil expenditures for Michigan as a percent of Michigan's Gross State Product (GSP). These expenditures are much less than the actual retail costs of Michigan businesses and households for petroleum products, which also include refining costs, wholesale and retail markups, and taxes. For instance, in Figure 5 the year 1990 falls exactly at 2 percent, representing crude costs

of $3.76 billion. But, the actual Michigan costs for petroleum products in 1990 were $7.2 billion, or 3.86 percent of the GSP. Again, as a rule of thumb, the total retail costs are about double the crude petroleum costs shown on the graph.

Michigan consumes less petroleum products per unit of output than the nation, as seen by comparing Figure 5 with Figure 4. In 1981-82, Michigan's petroleum expenditures peaked at less than 5 percent of GSP, compared to more than 6 percent nationally. Michigan's lower reliance on petroleum is due to the wide-spread availability of natural gas in Michigan.

Michigan would see less direct impacts of continued high oil prices than the nation, given the relatively lesser amount of petroleum fuel used in Michigan. However, the indirect and induced price impacts would be similar in Michigan as for the U.S. Indirect impacts would be based on the consumption of all goods and services, not just Michigan products. The induced impacts would be similar to national impacts, since wage agreements in Michigan would typically use a national price index rather than a local index. However, as noted above, wage increases are not as closely linked to consumer prices as they were in the past, and this would serve to mitigate the negative economic multiplier impacts on inflation.

Michigan Household Impacts

Although the aggregate economic impact of changing oil prices has greatly diminished, changes in the prices of petroleum products are significant for Michigan households. The average Michigan household consumes 1,006 gallons of gasoline per year. The abundant natural gas supply and an extensive pipeline network have reduced the number of homes heating with fuel oil since the

mid-1970s. Michigan's household consumption of fuel oil has declined from 800 million gallons annually in the mid-1970s to 165 million gallons currently. Seventy-seven percent of Michigan homes now heat with natural gas. There are 236,300 fuel oil-heated homes and 207,300 propane-heated homes in Michigan, comprising 7 percent and 6 percent of Michigan homes, respectively.


The adjacent graph shows the cost impacts of changing fuel prices for the average Michigan household. The fuel oil and propane costs are for an average home using these fuels, as are the gasoline figures. For the projected year 2000, the graph shows Michigan average household gasoline costs based on the U.S. Department of Energy's Energy Information Administration's national gasoline price projection. This projection shows very little change in gasoline prices for the rest of the year, which is also a reasonable assumption for propane and fuel oil.

Since January 1999, Michigan gasoline costs are up more than $400 per household at either current or year 2000 projected prices, as shown on the immediate graph. Fuel oil costs are up over $200 annually and propane costs are $300 higher. Households that heat with either fuel oil or propane

will see fuel cost increases of $600 to $700 a year, compared to last year. On a monthly basis, the impact is greatest in winter months (an increase of approximately $100 a month during the heating season) and does not reflect any changes in bills due to changing weather conditions.

Obviously, these additional costs cannot be avoided by most households and are significant for households on tight budgets. Also, the cost increases cut discretionary spending and may contribute to wage inflation pressures.


Longer-term actual and inflation-adjusted fuel prices for Michigan households are shown in the adjacent graphs above. After adjusting for inflation, current prices are still relatively low. Inflation-adjusted prices, shown in 1999 dollars, have been falling since the early 1980s and are not much higher now than before the oil embargo of 1973.

Michigan's average gasoline price peaked in real terms in 1979 at $2.92 ($1.27 actual), compared to the current price of $1.50 per gallon (AAA Michigan, February 21, 2000). The real price of heating oil and propane also peaked in 1979 at $2.11 ($1.15 actual) and $1.46 ($0.64 actual) per gallon, respectively. As of February 21, 2000, the average Michigan prices of fuel oil and propane were $1.19 and $1.20, respectively.

In summary, the reduced utilization of petroleum in the U.S. and Michigan economies in the past 20 years makes us less vulnerable to economic disruptions due to increases in crude oil and petroleum product prices. However, the recent price increases have been significant and, while they are not expected to cause a severe impact on the economy as a whole, the impact on low-income households can be crucial.

Prepared by the Statistical Analysis Section, Executive Secretary Division, MPSC, March 3, 2000

Sep 13, 2008

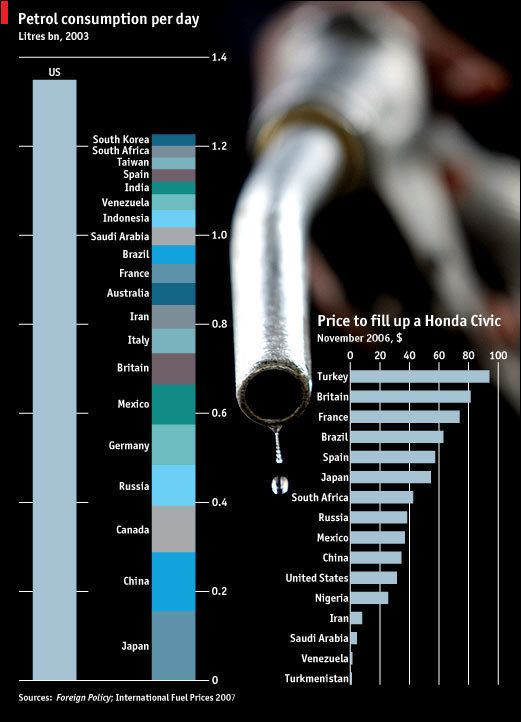
US Consumes More Gasoline Than 20 Other Countries

A Picture is Worth… Gasoline Consumption Per Day

In light of the Clinton-McCain gas tax holiday proposal I think this statistic (shown after the jump) from the Economist and BP Statistical Review of World Energy 2005 should be highlighted.

The image shows gasoline consumption per day around the world. It shows that the USA is consuming more gasoline than 20 other countries do together, every day.

If there is anyone that should get tax cuts it’s the people who buy small and fuel-efficient vehicles. Or even better, the people who use public transportation instead.

Gasoline Consumption Per Day

Dashboard of Energy Facts


US Sales of Hybrids Down 6% in July 08
Us_hybrid_sales_2008081
US sales of hybrids were down 6% in July 2008 year-on-year, for a new vehicle market share of 2.4% ofr the month.

Global Energy Consumption Up; Coal Fastest Growing Fuel

Bpstat1
The ongoing strength of world economic growth last year, despite financial market turmoil which began in August, continued to support global energy consumption. Although Growth in primary energy consumption slowed in 2007 compared to 2006, but at 2.4% it was still above the 10-year average for the fifth consecutive year, according to the BP Statistical Review of World Energy. Coal remained the fastest-growing fuel, but oil consumption grew slowly.

US VMT Down 1.8% in April; Sixth Straight Month of Declines

Dotapril2
US vehicle miles traveled (VMT) dropped 1.8% in April, for the six monthly decline in a row. Total estimated VMT for the month was 245.9 billion miles. Moving 12-month total shown.

Sales of Cars Pass Trucks Three Months Running

May08sales
Car sales in May exceeded truck sales for the third month in a row, with the gap between the two widening each of those months.

New US Hybrids in April Pass 3% Market Share

Us_hybrid_sales_2008041
Reported sales of hybrids broke past a 3% share of new vehicle sales in April 2008.
    Transportation: 30%; Residential, commercial, industrial with 20%+ share.

In terms of total US energy usage, the breakdown by source is given in the following table (for late 2001):

Energy SourcePercentage of total
Petroleum
42%
Coal
24%
Natural Gas
20%
Nuclear
8%
Hydro power
2%
Solar, Wind, etc.
2%

  • GENI Energy Map of the USA, power grid, nuclear plants
  • Obama: New Energy for America

    New Energy for America

    New Energy for America


    5 Million Green Collar Jobs

    A Bold New National Goal on Energy Efficiency

    American Energy

    Read the New Energy for America plan

    Watch Barack's speech in Lansing, MI on his new energy plan:


    Obama’s comprehensive New Energy for America plan will:

      Watch the Video
    • Provide short-term relief to American families facing pain at the pump
    • Help create five million new jobs by strategically investing $150 billion over the next ten years to catalyze private efforts to build a clean energy future.
    • Within 10 years save more oil than we currently import from the Middle East and Venezuela combined.
    • Put 1 million Plug-In Hybrid cars -- cars that can get up to 150 miles per gallon -- on the road by 2015, cars that we will work to make sure are built here in America.
    • Ensure 10 percent of our electricity comes from renewable sources by 2012, and 25 percent by 2025.
    • Implement an economy-wide cap-and-trade program to reduce greenhouse gas emissions 80 percent by 2050.

    ENERGY PLAN OVERVIEW:


    Provide Short-term Relief to American Families

    • Enact a Windfall Profits Tax to Provide a $1,000 Emergency Energy Rebate to American Families. 
    • Crack Down on Excessive Energy Speculation. 
    • Swap Oil from the Strategic Petroleum Reserve to Cut Prices.

    Learn More...


    Eliminate Our Need for Middle Eastern and Venezuelan Oil within 10 Years

    • Increase Fuel Economy Standards. 
    • Get 1 Million Plug-In Hybrid Cars on the Road by 2015. 
    • Create a New $7,000 Tax Credit for Purchasing Advanced Vehicles. 
    • Establish a National Low Carbon Fuel Standard. 
    • A “Use it or Lose It” Approach to Existing Oil and Gas Leases. 
    • Promote the Responsible Domestic Production of Oil and Natural Gas.

    Learn More...


    Create Millions of New Green Jobs

    • Ensure 10 percent of Our Electricity Comes from Renewable Sources by 2012, and 25 percent by 2025. 
    • Deploy the Cheapest, Cleanest, Fastest Energy Source – Energy Efficiency. 
    • Weatherize One Million Homes Annually. 
    • Develop and Deploy Clean Coal Technology. 
    • Prioritize the Construction of the Alaska Natural Gas Pipeline.

    Learn More...


    Reduce our Greenhouse Gas Emissions 80 Percent by 2050

    • Implement an economy-wide cap-and-trade program to reduce greenhouse gas emissions 80 percent by 2050. 
    • Make the U.S. a Leader on Climate Change.

    Learn More...


    GET THE DETAILS:

    Read the full version of Barack Obama's New Energy for America plan

    Barack's environmental plan

    Barack's plan to crack down on excessive energy speculation